David Stockman's Contra Corner
December 8, 2025
Today's number is 41X, representing the change in the public debt since early 1981, when Ronald Reagan's first fiscal challenge, ironically, was the unavoidable need to raise the ceiling on the public debt. That is, right out of the starting blocks he had been compelled to embrace the very bloated ogre he had campaigned against for more than two decades.
As it had happened, the Gipper inherited $930 billion of public debt as of December 1980, which in part represented the substantial additions during the Johnson, Nixon, Ford, and Carter years to which he had properly objected, and strenuously so. Still, the excesses of those years had not altered the post-war fiscal path, which was one of a continuously shrinking public debt burden on the national income (GDP).
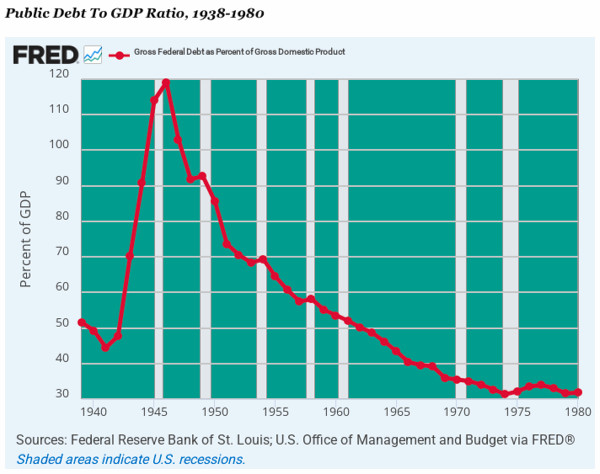
In fact, when the GOP-Dixiecrat coalition put an end to the New Deal in 1938, the public debt stood at 52% of GDP - before the exigencies of WWII sent the ratio soaring to a peak of 120% of GDP in 1946.
Yet financing this enormous war debt had not been a complete financial disaster because wartime rationing and economic regimentation had caused the private savings rate to soar, thereby enabling much of Washington's wartime borrowings to be financed by the public's real money savings, not the fiat credits flowing from the printing presses at the Federal Reserve.
Thereafter, of course, the 12-million-man US military was totally demobilized, causing defense spending to plummet and Uncle Sam's red ink to turn into nearly balanced budgets and actually intermittent surpluses. Accordingly, a growing economy returned to civilian control, coupled with the near absence of material budget deficits, triggered a 34-year march of the public debt ratio steadily downhill.
Indeed, after eight years of fiscal rectitude under President Eisenhower, the public debt ratio had already returned to the 1938 level at 52% of GDP. Moreover, even the subsequent excesses of the Great Society, Nixon's "we are all Keynesians now" fiscal policies, and Jimmy Carter's attempted purchase of his 1980 re-election with goodies for the teachers unions, the energy industries, farmers, and other Dem constituencies, did not stop the march back toward national solvency. By 1980, the debt ratio was just 31.8% of GDP.
But that's all she wrote.
As we will amplify below, during the Reagan era four crucial developments caused the nation's return to its historic fiscal prudence to be abruptly abandoned. Taken together, they have transmuted the once and former paragon of fiscal prudence on the banks of the Potomac-exemplified by 48 surplus budgets during the 65 years between 1866 and 1930-into an infernal debt and inflation machine in the years since 1980.
These history-bending developments include:
- The takeover of Washington by a bipartisan neocon coalition that has spent massively and needlessly on a bloated Warfare State and Empire abroad.
- The GOP's stinging defeat on Social Security reform in May 1981, which led to its going AWOL on its appointed role as nemesis of the Welfare State.
- The embrace by mainstream GOP politicians of the doctrine that tax cuts are a magic economic elixir that can generate a "growth" solution to chronic deficits.
- The takeover of the nation's central bank by Alan Greenspan and his heir and assigns, who installed Keynesian monetary central planning at the Fed. The consequent massive monetization of the public debt further euthanized the nation's elected politicians with respect to the folly of chronic and massive Federal deficits.
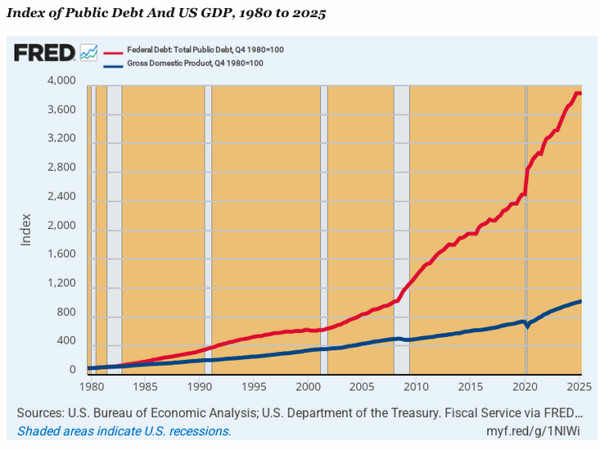
The chart below summarizes the results, and firmly reminds that the $38 trillion public debt level crossed recently is not just a case of big numbers vertigo. In fact, in Q4 1980, the GDP was about $3 trillion, meaning that today's $30 trillion GDP represents only a 10X gain in the nation's economic capacity to carry the public debt.
Needless to say, that's why the 41X number for the public debt gain during the same 45-year period is so salient. Self-evidently, you cannot grow the numerator of the debt-to-income ratio four times faster than the denominator for decades on end and expect an eventual outcome that is anything short of catastrophic.
Yet that's the sum and substance of America's fiscal path since 1980. In the graph below, both variables are indexed to the levels of Q4 1980-so the ever-widening gap between the public debt (red line) and the US economy's capacity (blue line) to carry it is unmistakable.
The thing is, however, the GOP of 1980 would have never dreamed of embracing the graph below. Yet the recently passed and endlessly ballyhooed OBBBA, which might better be called the MOABB ("mother of all budget busters"), will actually accelerate the current built-in trend.
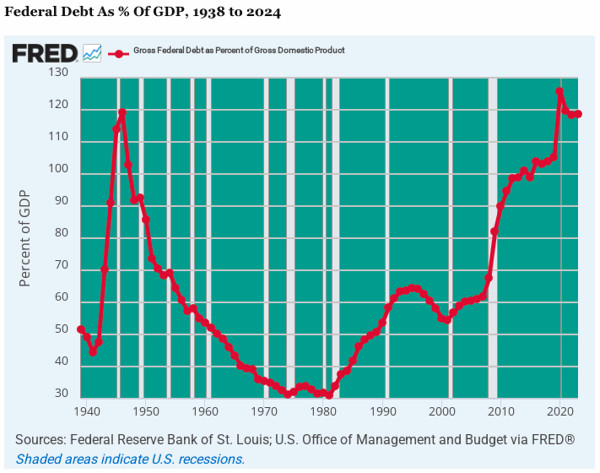
For want of doubt, here is the debt ratio trend since 1980. It embodies a fiscal path that is the absolute inverse of the 1946 to 1980 trend shown above. In fact, during the 45 years since 1980 the debt ratio has tracked all the way back to its WWII peak. Alas, the US economy was drowning in private savings to absorb the debt back then, while today the private savings rate has shrunk to nearly the vanishing point.
Needless to say, this condition puts enormous pressure on the Fed to find an excuse to revert once again to massive debt monetization. Yet with inflation rates trending at +3% and heading higher, the Fed's printing press has been forced into idleness and may stay there for some time to come.
And that's notwithstanding the phony "interest rate cuts" being administered from the Eccles Building, which are the result of paying massive levels of interest payments to banks and money market funds to keep their liquid reserves parked at the Fed at the central bank's pegged interest rate target.
To be sure, if the retaking of the WWII peak debt ratio shown below for 2025 were the end of the story, the future outlook would be bad enough-with either a massive, economy-killing interest rate crunch, if the rising Federal debts were financed the honest way in the bond pits, or another even worse inflationary blow-off, if the Fed's printing presses are again put into over-drive.
But that's not the half of it.
The built-in baseline deficits, which would have continued to track the rising path shown below, and would have actually broken into new territory relative to GDP, even had the MOABB been snuffed out on Capitol Hill, as it should have been. Instead, of course, trillions of new debts were layered on top of the inherited baseline, such that the debt ratio will soar to 166% of GDP by 2054.
In round terms, therefore, the built-in public debt barely 30 years down the road will reach $185 trillion!
And that's not a case of big numbers vertigo, either. The CBO projection of GDP for 2054 now stands at $85 trillion, meaning that the gap between the public debt burden and the national income will continue to widen, and actually accelerate, along the path shown above. That is to say, by mid-century the GDP will be 28X larger than it was in 1980, but the public debt will be up by 185X.
Needless to say, the financial market will buckle and cause the US economy to collapse long before we reach the currently built-in public debt level of $185 trillion by 2054. If for no other reason, there is precious little savings available to honestly finance the UniParty debts, and, as will be evident in the years ahead, the Fed is essentially out of dry powder when it comes to massive monetization. The bond vigilantes have come out of their decades-long slumber.
So how do you finance the built-in 6% to 10% of GDP deficits year after year when net national savings have already vanished?
You can't. American politics are locked on a path toward fiscal calamity because we now have two pro-government parties. That includes the Warfare State spenders of both parties, and the Welfare State demagogues and cowards, respectively, of what passes for contemporary Democrat and Republican parties.
Reprinted with permission from David Stockman's Contra Corner.