David Stockman's Contra Corner
September 15, 2023
It was CPI day. So it might be expected that some anomaly in the monthly data would provide a timely reminder that Washington's main inflation index isn't all it's cracked up to be. In the context of our Monetary Mission Impossible series, it also provides further proof that the Fed's fanatical quest to reach its 2.00% inflation goal is utterly misguided.
As it happens, the number -33.6% contained in the August CPI report fulfills both of these expectations and then some. This figure supposedly represents the Y/Y plunge in the cost of medical insurance!
That's right. Anything connected to the medical delivery system was up by hefty amounts in August on a Y/Y basis, but the thundering collapse (purportedly) of health insurance costs allegedly saved the day. As shown below, according to the BLS the index for overall medical services was down -2.1% on a Y/Y basis in August when all of its other components where positive, some of them like dental care and home health services strikingly so.
Y/Y Change In CPI Medical Services And Its Components:
- Dental services: +5.3%;
- Eye care:+3.4%;
- Physicians: +0.3%;
- Home health services: +6.9%;
- Hospital services:+3.0%;
- Nursing home care: +6.1%;
- Health insurance: -33.6%;
- Overall Medical Care Services: -2.1%
Needless to say, how fully one-third of medical insurance costs up and disappeared over the last 12 months needs some ‘splainin'. That our friend Wolf Richter has done about as incisively as can be done—given the absurdity of the outcome.
Every fall, the Bureau of Labor Statistics, which produces the CPI, undertakes annual adjustments in how it estimates the costs of health insurance. It then spreads those adjustments over the following
12 months. Last year, this adjustment cycle started in October, and it will go through September this year…..
Inflation in health insurance is difficult to figure because numerous factors change, not just the premium but also co-pays, deductibles, out-of-pocket maximums, what is covered and what isn't covered, drug formularies, etc., and there are all kinds of insurance plans out there, and they all differ locally and by state.
So the BLS uses a different method to estimate price changes of health insurance, the "retained earnings method," which the BLS explains here. In the fall each year, it adjusts the index as more data become available.The entire index is an annual figure, divided into monthly increments,based on the annual "retained earnings" of insurance companies. So the month-to-month percent-changes of health insurance CPI are about the same every month for a 12-month period, and then it gets adjusted again, usually the other way.
Normally the annual adjustment isn't such a huge deal, but this time, the adjustment was ridiculously gigantic, with totally perverse effects.
For the prior 12 months through September 2022, CPI overstated health insurance inflation by some amount. By September 2022, the health insurance CPI had risen by 28% year-over-year, which contributed to the big increase in CPI at the time.
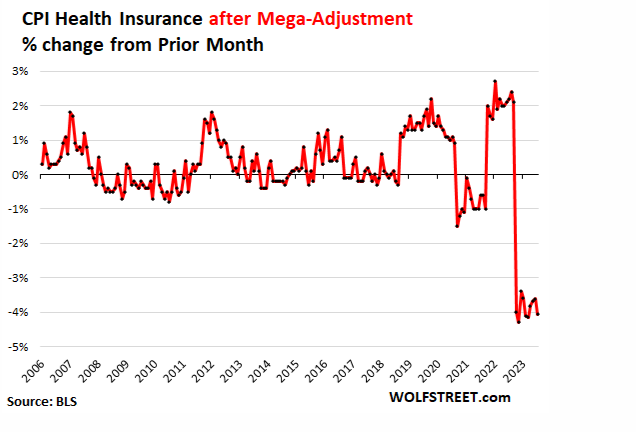
Then in October 2022, the adjustment kicked in. Every month since then, the CPI for health insurance, thanks to this odious adjustment, plunged month-to-month by a ridiculous 4%, give or take. In July, it plunged by 4.1% from June.
This 4% month-to-month plunge, as opposed to a 2% month-to-month rise in the prior year, represents a month-to-month swing of 6 percentage points!
This chart shows the month-to-month percentage changes of the health insurance CPI, including the last 10 months after the odious ridiculous massive adjustments:
So, yes, if you believe all of the above, health insurance prices have collapsed by more than one-third and the long running inflation in the overall medical care index has turned into a big fat negative. And, also, if dogs could whistle the world might well be a splendid chorus, too.
Now, if the BLS were just in the public misinformation business this kind of puzzle palace absurdity would be of small moment—just another case of bureaucrats advocating six impossible things before breakfast. But, unfortunately, the BLS is the Fed's handmaid in the the very serious business of inflation micro-management and money-printing.
So all of these anomolies—such as the fact that the OER (owners equivalent rent) accounting for 24% of the CPI weight is not even measured but is imputed—matter a great deal. In the current case, in fact, the purported 33.6% health insurance plunge has had an overwhelming impact on the Fed's machinations, and not of the good kind, either.
To wit, the Fed's current leading lights around Jay Powell have pretty well conceded our points from Part 1 & 2 that they have precious little control over globally-priced items like energy, foodstuffs, other commodities and the great bulk of durable goods sourced in China and the off-shore low-labor cost supply chains.
So Powell has taken to talking about the "supercore" inflation rate, which is based on the services components of the CPI excluding the shelter items. In the latter case, even the Fed heads apparently recognize that the lag time between policy action in the Eccles Building and impact on the measured inflation rate might be extremely extended and uncertain because shelter is now based on rent level changes, not housing prices.
The problem with that is raising rates used to cause demand for new home purchases and mortgage financing to drop sharply, thereby providing a short and direct linkage between interest rate increases and reduced inflation readings on home prices. But that linkage was broken when housing prices were banished from the CPI in the 1980s. Their replacement with rents obviously had some conceptual merit, even though it required the BLS to ask survey respondents to take a SWAG (scientific wild ass guess) about what they would rent their castle for, were they to move out into a teepee and become a one-unit landlord.
Of course, when interest rates are now raised sharply to fight inflation the main effect is that it eventually causes new construction, especially of rental units, to fall. Yet, all things equal, most households do not borrow money to pay their rent (for long!) so the impact of higher mortgage rates is reduced supply but no material reduction in demand. Consequently, tighter money leads to a tighter supply/demand balance in the rent markets than would otherwise be the case, thereby causing rent prices to rise, not fall!
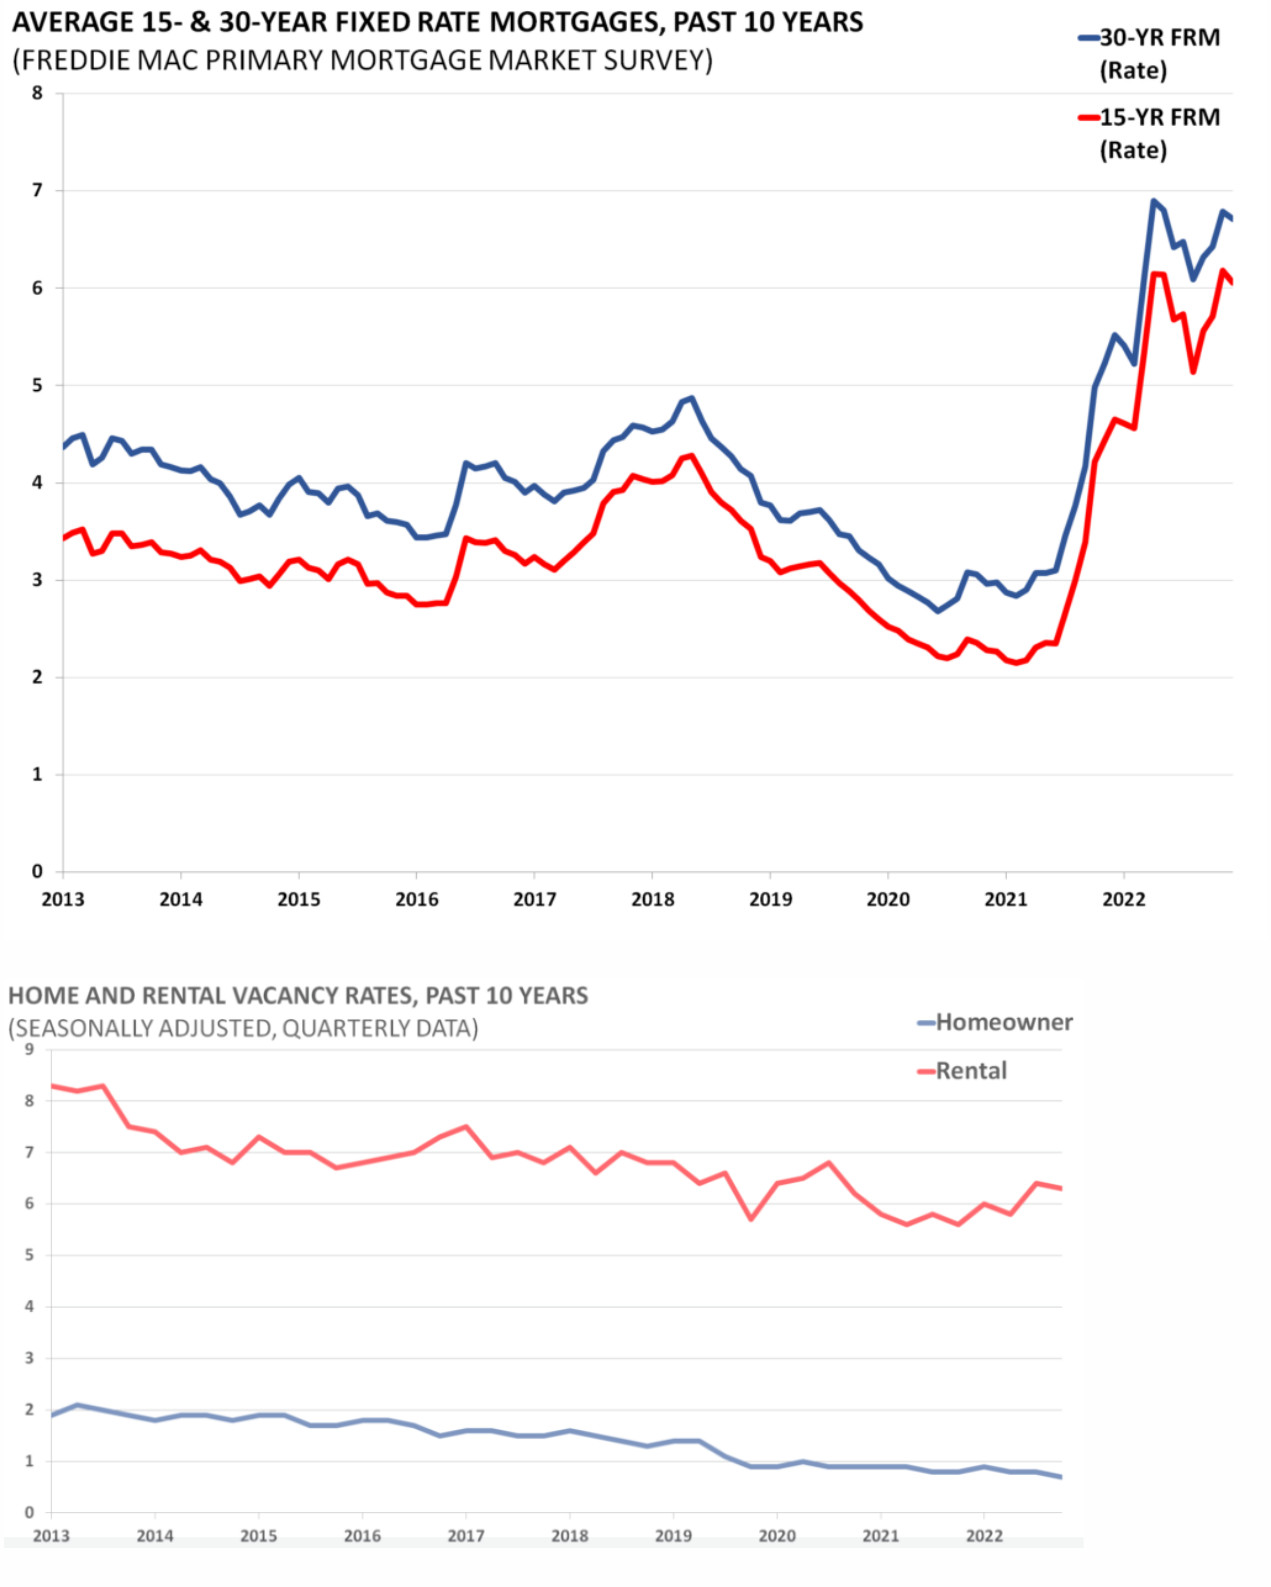
The two charts below illustrate this disconnect. Mortgage rates have surged from 3% to 7% during the last two years in classical fashion, yet both rental and homeowner vacancy rates have continued to trend downward, suggesting little if any decline in demand. Only in the case of rental properties has there been a slight upward blip in recent months of the vacancy rates. In all, therefore, the hammer of interest rate increases has lost its potency with respect to the 34.4% of the CPI basket accounted for by rents of shelter.
In any case, the monetary transmission channel for shelter has become decidedly murky. So Powell & Co have punted and simply removed it from the supercore index. No sweat!
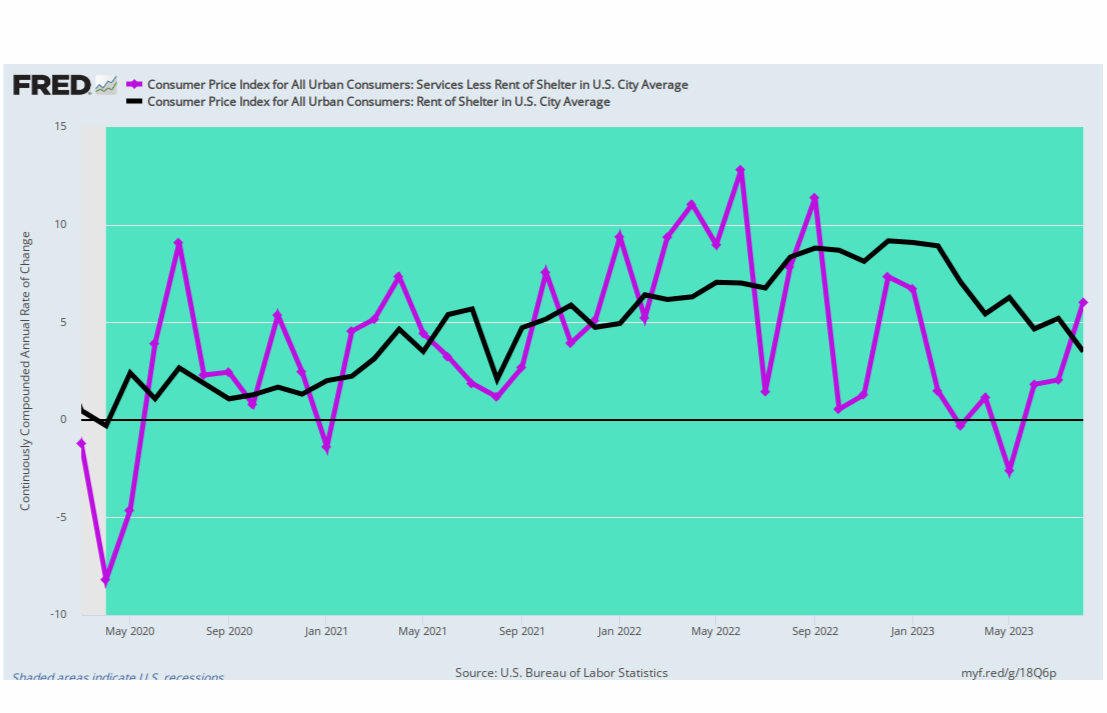
Then again, maybe not so fast. The annualized rate of change (purple line) of the rent of shelter index has been rising for the past three months, weighing in a +6.0% in August. Accordingly, the 3.5% Y/Y rate (black line) posted in August may be all she wrote in terms of the previous down-trend.
Cynics have long understood why the Fed prefers to exclude food and energy from the inflation index when these items are rising strongly on a cyclical basis. But now, it appears, they are setting aside another one-third of the entire inflation basket when it is still rising at a 3-4% annual rate. Some inflation victory, that.
Change In Rent Of Shelter Index, Monthly Annualized Versus Y/Y, March 2020 to August 2023.
Alas, this has all led to a comedy of shrinking yardsticks. To wit, the services components account for 61.7% of the CPI weight, but when you take out rent of shelter what you have left is just 27.3% of the total CPI basket. That's the ballyhooed "supercore".
Yet, that's not the half of it. It turns out that the utterly phony -2.1% Y/Y reading for medical care services accounts for a modest 6.4% of the overall CPI, but 23% of the supercore. In other words, a complete statistical abberation has been artificially driving down the rate of increase in the metric that allegedly now sits front and center on the Fed's inflation dashboard.
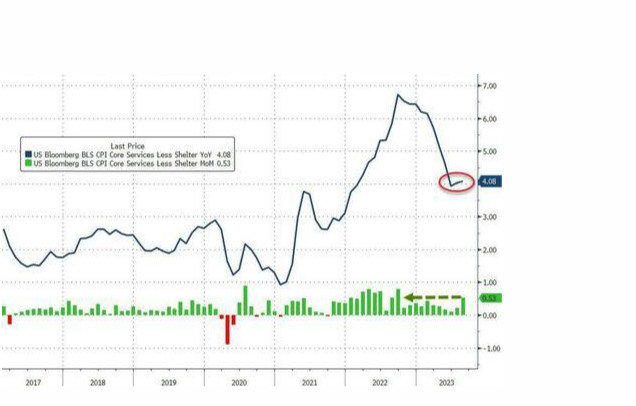
The chart below from Zero Hedge, in fact, is nothing less than the smoking gun. Notwithstanding the massive help from negative medical services inflation, the supercore still rose by 0.53% MoM and 4.08% on Y/Y basis.
But here's the thing. As highlighted by the MoM green bars in the graph below, since last October the supercore CPI gains have been marching briskly downhill, bringing the Y/Y reading (black line) steadily lower. But recall the points from Wolf Richter above. To wit, during the previous fiscal year ending in September 2022, the health insurance index had risen by 28%. So last time around the barn the BLS' dubious health insurance proxy caused the green bars to march briskly higher and the year-over-year rate to ascend nearly vertically.
In short, the so-called supercore way over-measured the one-fourth of the CPI basket the Fed is now focused on during FY 2022 and is now under-measuring it by an even greater amount during FY 2023. Except, after one more monthly reading the green bars will be doing another student body left, with Y/Y supercore heading back uphill again after a few months lag as we move into 2024.
Supercore Inflation Rate, 2017 to 2023
Source: Bloomberg
For want of doubt, here is the monthly Y/Y change in the CPI services index and the medical care services component thereof for the last 22 months. Self-evidently, in attempting to fine-tune the inflation rate to the arbitrary goal of 2.00%, the Fed is actually marching to the tune of pointy-head statisticians at the BLS who have gotten lost in the inflation measurement wilderness.
The overall services component of the CPI (red bars) marched steadily higher from 3.2% Y/Y in September 2021 to a peak of 7.4% in September 2022—owing to the even steeper climb of the medical services sub-component (black bars). The latter rose from 0.8% to 6.5% during that 12 month period on the back of the 28% annual gain in the medical insurance proxy.
Since then, of course, the medical services component is down to the aforementioned – 2.1% in August 2023, again on the back of the BLS' whacko medical insurance proxy. In turn, the overall services reading has dropped to +5.4%—almost entirely due to the phony plunge of the black line for medical services.
In short, the services CPI readings during the months of FY 2022 were significantly overstated owing to the health insurance proxy, while those during the last 10 months have been drastically understated. Based on the science of eye-balling it is safe to say that overall services inflation—the components of the CPI that the Fed's demand management policies can possibly influence—had climbed to well above 6% and are actually still there, as the post-September health insurance adjustment factor for FY 2024 will almost certainly reveal.
Instead of celebrating its victory over too -high inflation the Fed ought to batten down the hatches because 2 or 3 months from now the whole "progress on the supercore" inflation index will prove to have been another tall tale from the BLS puzzle palace.
Y/Y Change in CPI Services And CPI Medical Services, September 2021 to August 2023
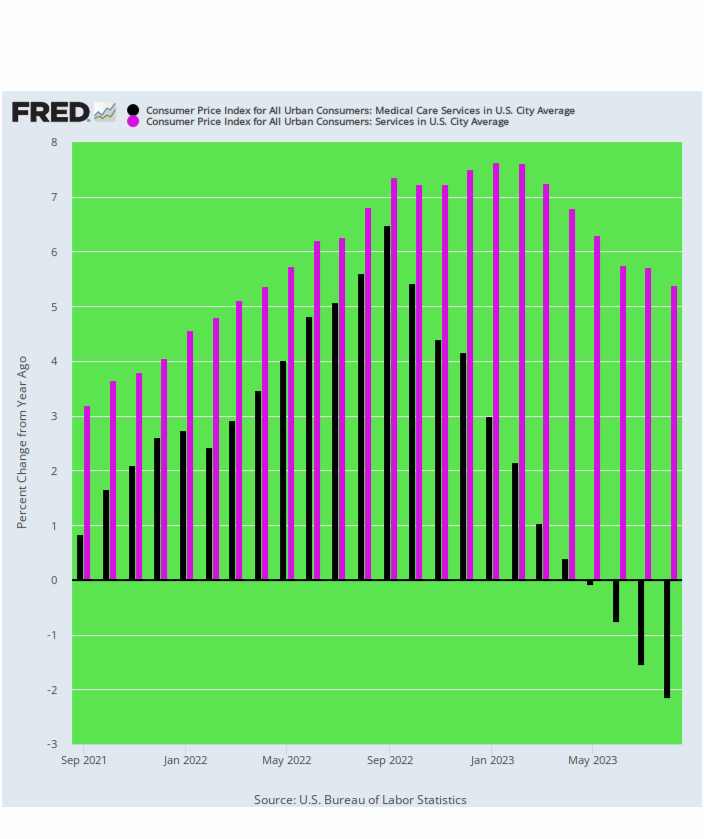
Needless to say, anyone with their head screwed on right would not believe that the inherently inflationary, government-funded medical service sector has swung violently to deflation as implied by the chart above.
Yet that's where the monetary politburo now finds itself impaled. That is, squinting at 27% of the CPI (i.e. the supercore) in order to calibrate its anti-inflation "tools" when this sawed-off inflation metric is so distorted by the BLS's whacko health insurance proxy that it's not worth the paper it's printed on.
In this context, we next note that we are now in a world in which bank regulation via cash reserve cushions has been abolished in favor of capital ratio regulation via Dodd-Frank and its regulatory progeny. That means there is no need for the Fed's open market operations at all, and therefore any inflation target at all—let alone the bedraggled and groundless 2.00%.
Reprinted with permission from David Stockman's Contra Corner.
