David Stockman's Contra Corner
March 22, 2024
There is surely no development more inimical to main street prosperity and democratic governance than the lock, stock and barrel capture by Wall Street of the nation's central bank. That baleful condition enables and sustains the two very worst forces in American society today-the spenders and warmongers of Washington and the Wall Street speculators, who otherwise claim to be traders and asset managers.
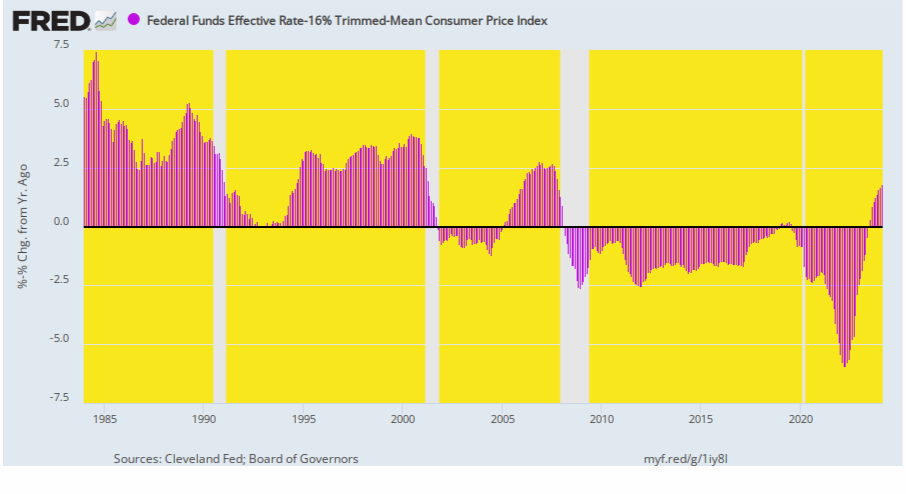
The not-so-secret sauce of the Fed's rogue monetary regime, of course, is artificial, ultra-cheap interest rates, which have been sustained over extended periods of time. In fact, the Fed's key policy instrument-the Federal funds rate-has stood at negative levels in inflation-adjusted terms for more than 93% of the time since March 2008. And even the current positive rates barely peeking above the zero bound per the chart below are still far, far below the healthier levels recorded from 1984 through the year 2000.
Yet ever since the real funds rate turned marginally positive in July 2023 the crescendo of drumbeats on Wall Street for a new round of rate cutting has become overwhelming. Then again, what the hell was so onerous or economically oppressive about the real Fed funds rate at just +1.82% in February?
To hear the Wall Street crowd tell it you'd think the US economy was about to be drop-kicked into the recessionary drink in the absence of a new round of rate cuts. But that's just risible, blithering nonsense. The only plausible reason for rate cuts after years of negative-cost money in real terms is to trigger and sustain a new bubble atop the already wildly inflated stock market.
Let us repeat. It's all about enabling leveraged speculators to chase stock prices higher. That's owing to the fact that lower rates will cause PE multiple expansion while simultaneously reducing the funding cost of those positions via cheaper margin loans or options premiums.
That's the racket. That's the entirety of what the Fed's "rates policy" is all about. And it's a pretty pitiful state of affairs indeed because there is no imaginable reason of state to help the one-percenters speculate more successfully, and to thereby even further tilt the distribution of financial wealth to the tippy-top of the economic ladder.
Inflation-Adjusted Federal Funds Rate, 1984 to 2024
To be sure, the Fed heads and their Wall Street shills insist that the hideous repression of interest rates shown above was all in the service of making life better on main street. That is, causing higher levels of business investment, more residential housing construction and a less volatile business cycle.
The problem, of course, is there is not a shred of evidence for those propositions. And we mean none as in nada, nichts and nugatory.
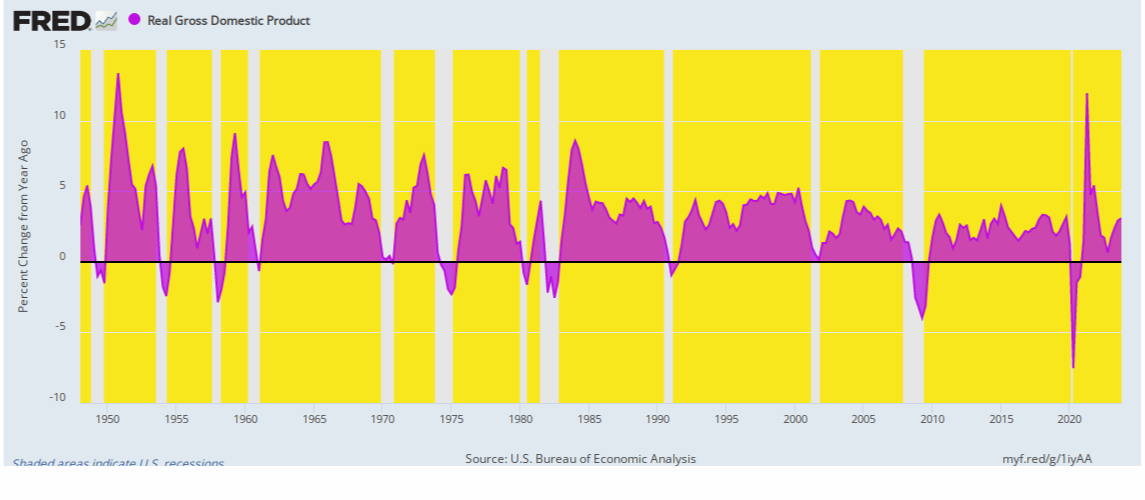
For instance, here is a chart of the business cycle since 1948 as measured by the annualized rate of real GDP change. The recessionary bottoms during the last two recessions have actually been deeper than during any of the 10 downturns before the Great Financial Crisis of 2007-2009. And aside from the aberration of the lockdown plunge and rebound of 2020, business cycle recoveries during recent decades have generally been weaker, too, which is not anything to write home about.
Awhile back, Ben Bernanke even had the nerve to crow about the "Great Moderation" during his early years on the Fed. The implication was that owing to the superior efforts and insights of the 12 members of the FOMC the historical turbulence of the business cycle had been thoroughly ironed-out.
Alas, that untimely speech was given in March 2004, but everything on the chart right of that date more nearly suggests the opposite.
Annualized Rate of Real GDP Change, 1948 to 2023
Likewise, scratch a Fed apologist and they will say because housing. We think not, of course.
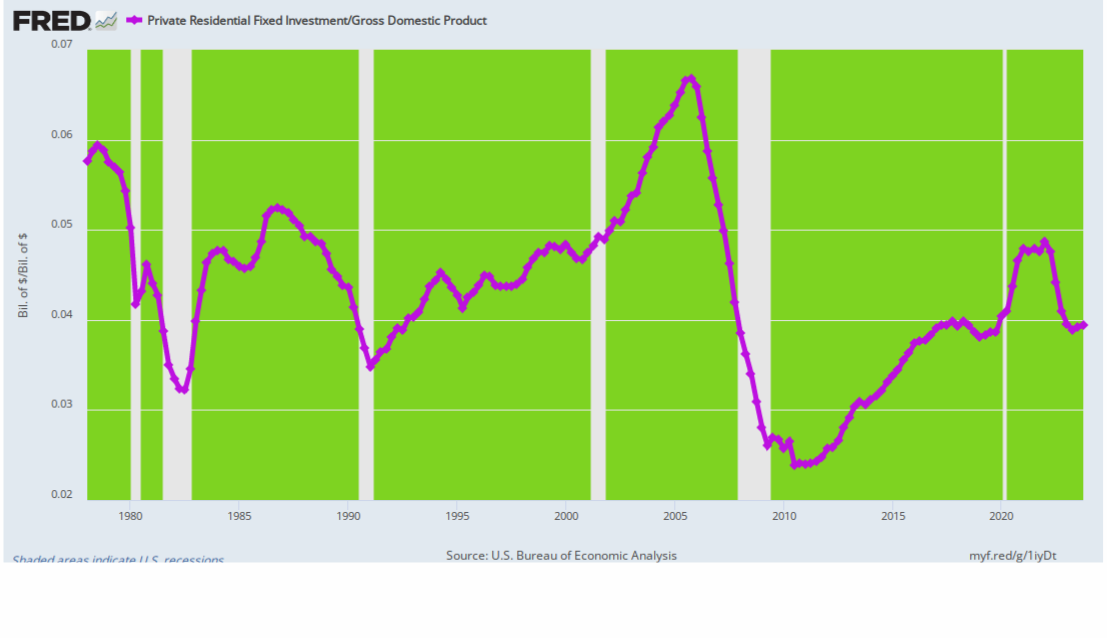
After all, the shift to rampant money-printing incepted with Greenspan in 1987 and has gotten progressively more aggressive ever since. Yet aside from the infamous Greenspan housing bubble of 20o3 to 2006, which was short-lived and gave everything back and then some on the downside, there has been no increase in the share of GDP devoted to residential housing construction. In fact, on a smoothed basis, the trend has been to lower, not higher, residential housing investment.
Besides, there is more than one way to skin a cat -if the societal policy objective is more housing opportunity for those most in need. The latter can be achieved via means-tested direct subsidies, say in the form of mortgage buydowns, at far lower cost and with none of the adverse collateral effects of cheap mortgage rates.
By contrast, artificially repressed market interest rates accrue to the rich and poor alike, thereby conferring far greater dollar value among the former who often use multi-million dollar "jumbo" mortgages to finance their primary residence, to say nothing of second and third homes, too.
Residential Investment As % of GDP, 1978 to 2023
At the same time, the unfortunate collateral effect of below-market mortgage rates is to cause the price of existing housing stock to be bid -up, thereby conferring huge windfalls on existing homeowners and barriers to entry for newly formed households entering the market for the first time.
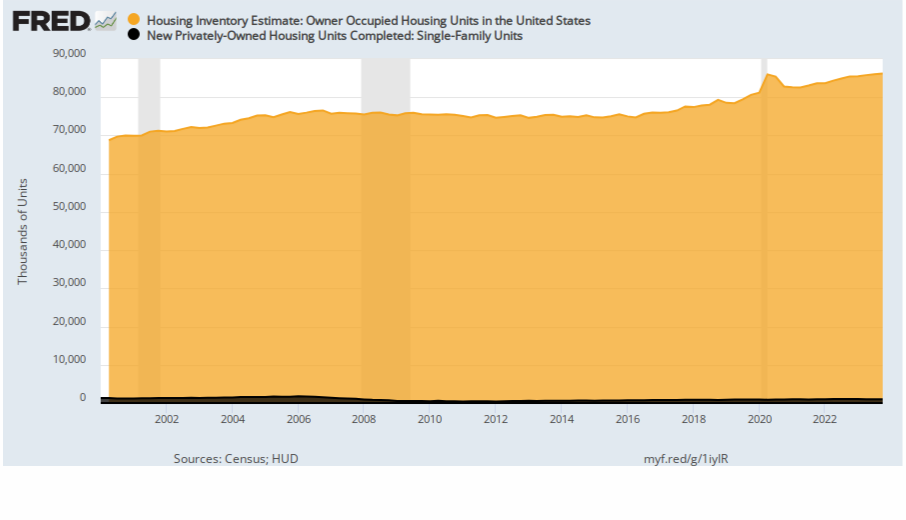
Given the long-lived nature of the residential housing stock, in fact, this collateral effect is especially acute. In the case of single-family residences, for instance, there are currently 86.2 million owner-occupied units (orange area), but the new construction level in the most recent (and typical) quarter was just 993,000 units at an annual rate (black area).
Accordingly, the new supply usually amounts to just 1% of the existing stock, meaning that a market-based interest subsidy is bloody inefficient, if the objective is spurring new housing supply.
Moreover, that inefficiency pertains not just to the 3.5 to 4.0 million existing single-family units which turnover each year. The market price effect impacts the value of all units, whether for sale or not; and such value inflation can be accessed by non-selling owners via refinancing their property or otherwise using the asset as collateral.
At the end of the day, the real public policy issue with respect to residential housing is income distribution or needs-based household support, not the level of new construction per se. Consequently, the mortgage rate should be left to the market, with public resources channeled exclusively through targeted means-tested transfer payments.
New Supply Versus Existing Stock of Single-Family Homes, 2000 to 2023
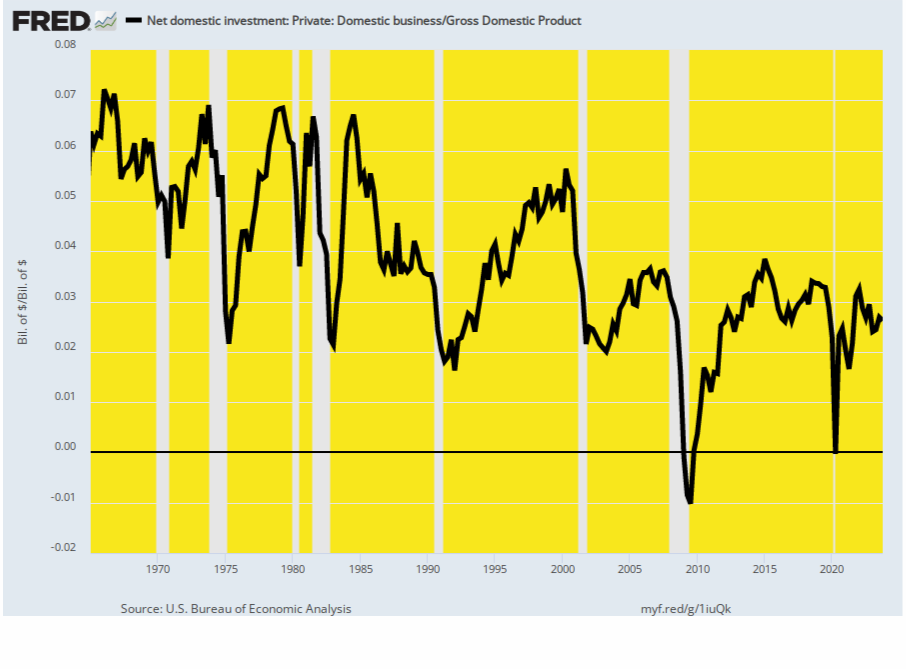
There is no case for cheap interest rates in order to spur non-residential or business sector investment, either. As shown below, the data on net business investment thoroughly refutes the Fed's cheap money axiom. Whereas net business investment ranged in the 5-7% of GDP range before the Greenspan era, in recent years it has barely averaged 3% of GDP.
Moreover, it should be noted here we are using the proper measure of business investment. That is, new investment after deducting the current year consumption (depreciation) of the existing capital stock. After all, that's actually what is available from annual business investment to fund improvements in productivity or expansion of capacity.
Net Business Investment As % Of GDP, 1965 to 2023
So the question recurs. If the Fed's hyper-active interventions and manipulations of interest rates and assets prices on the Wall Street money and capital markets do not smooth the business cycle (let alone eliminate recessions), spur higher housing investment or cause business investment to rise, then the only macro sectors left are household consumers and governments.
Then again, there is no magic in lower interest rates. The only thing they can plausibly do as a mechanical matter is to cause borrowers to take on more debt than would otherwise occur on the unaided free market.
Then again, why would policy-makers want to encourage even more household and government debt on top of the towering levels which already exist?
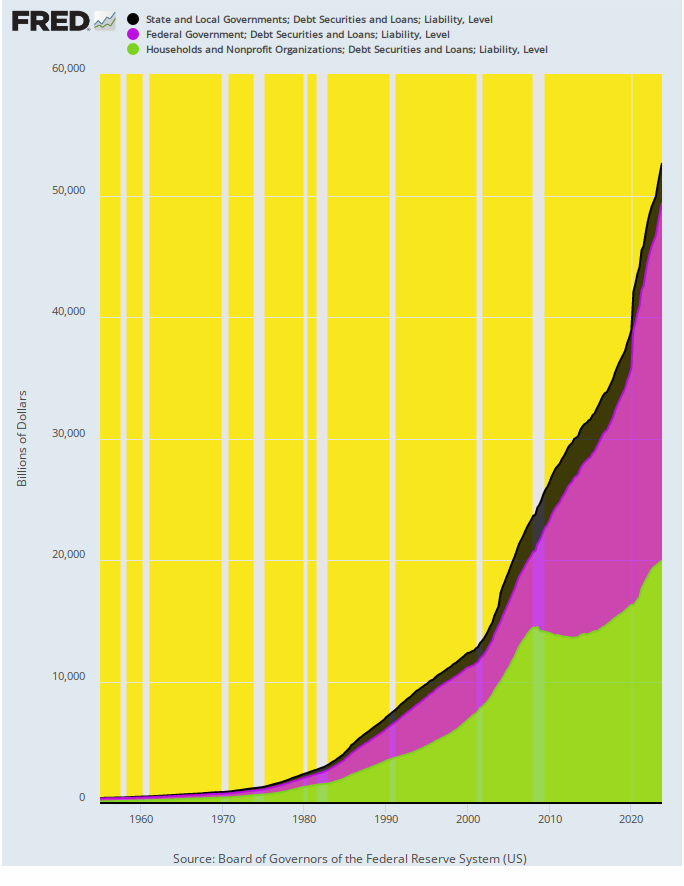
And we do mean towering. Back in the heyday of American prosperity in 1955, the combined debt of governments and households amounted to just $408 billion or 99% of GDP. By the eve of Greenspan taking the helm at the Fed those figures had climbed slowly, reaching $5.6 trillion and 117% of GDP in Q2 1987.
But after the printing presses were fired up on a continuous basis and ultra-low nominal and real interest rates became the norm, it was off to the races. At the end of 2023, therefore, the total debt of governments and households in the US stood at $52.7 trillion and nearly 190% of GDP.
Needless to say, any central bank policy that explicitly or even tacitly aims to induce even more borrowing and still higher leverage relative to income among governments and households in the US is not even remotely rational. It's merely a mechanical default to Keynesian catechism, which erroneously holds that consumers, workers, investors, savers and entrepreneurs interacting freely in the marketplace of commerce will inherently spend too little and save too much.
Alas, that's simply statist doctrine. It has no empirical foundation and is antithetical to the very notion of free markets and economic liberty.
Household and Government Debt, 1955 to 2023
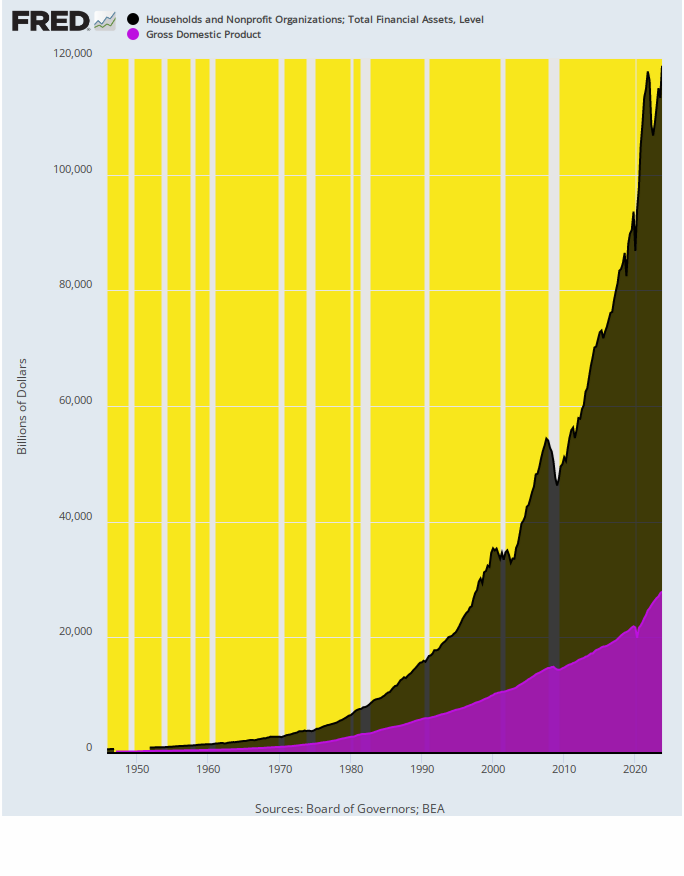
Needless to say, all that Fed money-pumping did not go into an economic blackhole, leaving no visible trace on the US economy. To the contrary, what happened was the massive financialization of American economic life, which phenomena can be conveniently measured by the market value of all financial assets-stock, bonds, real estate-relative to national income.
As it happened, the market value of household financial assets (black area) stood at $1.1 trillion in 1955, representing 267% of national income (GDP). And while the dollar level had grown substantially to $12.8 trillion by Q2 1987, the ratio to national income remained steady at the same 267%.
No longer. At the end of 2023 total household financial assets (at market value) had erupted to nearly $119 trillion and represented 425% of GDP. That is to say, the trend rate of economic growth had dropped from 3.5% per year prior to Greenspan to barely 1.5% per annum during recent decades.
And yet and yet. A dramatically weaker economy-freighted down by $97 trillion of total debt-is now sporting a dramatically higher load of financial assets.
Once upon a time, advocates of sound economics would have called the chart below a house of cards, and it surely is.
No wonder the entitled brats, big swinging dicks and irksome whiners of Wall Street are desperately pleading for still another round of low-interest monetary dope.
Household Financial Assets Versus GDP, 1955 to 2023
Reprinted with permission from David Stockman's Contra Corner.