David Stockman's Contra Corner
April 20, 2024
When it comes to Keynesian central banking, it might well be said that if you paint by the numbers you are stuck with the brush. That is to say, the Fed has turned its 2.00% target into an economic holy grail and therefore does not dare risk a rebound of the 40-year high inflationary pressures that remain directly in the rearview mirror.
Yes, the inflation gauges have cooled considerably since the 9% CPI (Consumer Price Index) peak of June 2022, but the Fed is not yet remotely out of the woods. In fact, when the inflation tide is viewed through the more stable and reliable lens of the 16% trimmed mean CPI, which peaked at a somewhat lower 7.2% level in 2022, the year-over-year (Y/Y) gain at 3.7% in January was still barely halfway back to the sacrosanct 2.00% goal.
Indeed, the annualized three-month rate of change in the trimmed mean CPI has rebounded to 4.0% already, while the annualized rate for January came in at a red hot 5.7%.
So, as much as the boys and girls on Wall Street insist on getting their juice, the paint-by-the-numbers crowd in the Eccles Building (Fed HQ) is not nearly there yet.
Y/Y Change in the 16% Trimmed Mean CPI, April 2020 to January 2024

For avoidance of doubt, just recall the horrific charts of 1967 to 1982. Back then the good folks in charge of the Fed were not even explicitly in the Greenspanian monetary central planning business but still had to generate four recessions during that span in order to get the inflation genie back in the jar.
To be sure, the twentysomething traders on Wall Street, who are braying ever more insistently for initiation of the next rate cut cycle, undoubtedly confuse the 1970s with the 1790s. It's all an ancient blur in their minds, apparently.
The graybeards working toward their pensions in the Eccles Building, however, are not quite so nonchalant. They recall the triple peak of inflation from that era and undoubtedly still have the chart on their dashboards. The thundering central bank failure implicit in three inflationary surges (red bars) and four recessionary contractions (white areas) in just over a decade nearly destroyed the Fed's open-ended remit as the nation's unelected monetary politburo, to say nothing of its credibility on both ends of the Acela Corridor (New York and Washington, D.C.).
Y/Y Change in the CPI, 1967 to 1984

Therefore the current gang in charge is not about to flinch on their "higher for longer" call until they can see clearly the whites of those 2.00% inflationary eyes.
We don't expect this prayed-for condition to be attained any time soon. That's because the truth of the "lowflation" mirage of the last several decades cannot be buried indefinitely, nor even for much longer. Union Terror: Debunkin... Best Price: $19.76 (as of 08:52 UTC - Details)
We are referring, of course, to the fact that there was a whole lot of inflation from the Fed's madcap money printing even before it pulled out the stops on its printing presses in response to the so-called COVID-crisis in March 2020. But most of that came out in financial asset prices and in the real estate sector, bubbles that Wall Street pronounced to be a swell thing.
At the same time, most of the rest was temporarily exported to the rest of the world via the Fed's flood of dollar liabilities, which were compliantly scooped up by mercantilist central banks in China, the petro-states and elsewhere in the rapidly mushrooming low-cost global manufacturing supply chains.
The chart below is not simply striking evidence that the 1.8% average inflation rate during the first two decades of this century was an aberration; it is actually the smoking gun!
Index of US Unit Labor Costs, 1970 to 2020
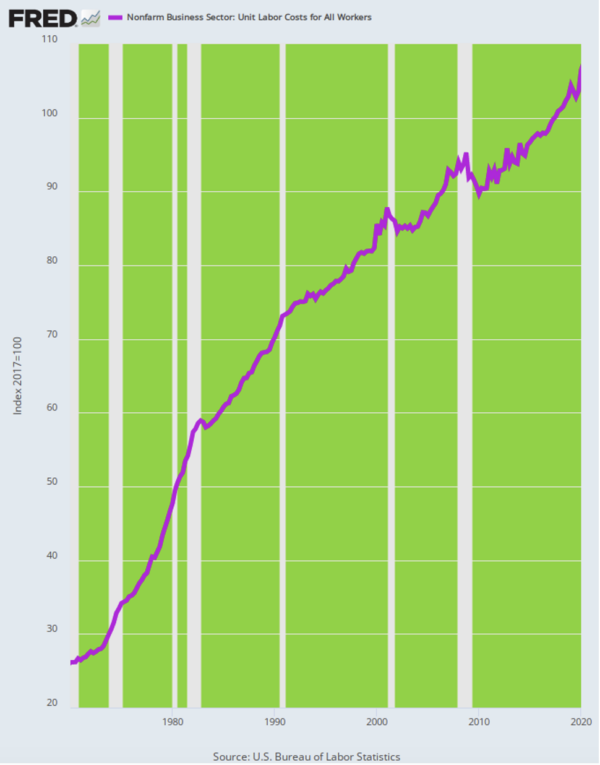
The Fed had grotesquely inflated the US economy during the 1970s cycles shown above and had been merely content to slow the further rise of these drastically higher price levels by the aforementioned 2.0% per annum during the later 1980s and 1990s. This occurred even as Mr. Deng was converting Mao's ossified Communist economy into a manufacturing powerhouse by dint of a red hot capitalist style printing press at the People's Bank of China and several hundred millions of newly-minted industrial workers flushed out of the rice paddies and subsistence villages of China.
American industry and wage workers had no chance. Thanks to the pro-inflation policies of the Fed both before and after Greenspan - save for the short interval of "Tall Paul" Volcker's rescue of the American economy from the inflationary abyss - unit labor costs by the year 2000 were 235% higher than they had been in 1970 and by the eve of the pandemic crisis in March 2020 were actually up by 310%.
Of course, the soaring purple line in the chart above wasn't supposed to matter according to the Keynesian economists running US economic policy. If America's trade deficit got too large owing to massive offshoring and mushrooming trade deficits, surplus countries abroad like China were supposed to experience exchange rate appreciation and thereby an offsetting reduction in their competitive cost advantage.
Alas, that assumed printing-press money in the US would be countered by sound money abroad. Fat chance!
Foreign central banks printed stride for stride and then some with the Fed under what is best described as the "dirty float." So doing, they bought up trillions of unwanted dollars, expanding their own money supplies as they did so, thereby keeping their trade surpluses intact and showering their export industries with cheap credit and capital.
So offshoring never slowed down. The exchange rate corrections and rebalancing of trade accounts never happened.
There is no mystery, therefore, about the cause of the great labor arbitrage and resulting offshoring of America's industrial economy over the last 40 years. To wit, the objective condition of the global economy and internet linkages of producers and consumers everywhere on the planet meant that the US needed a sustained period of cost deflation to purge the inflationary excesses of the 1970s and after, not the pro-inflation policy that the Fed actually conducted.
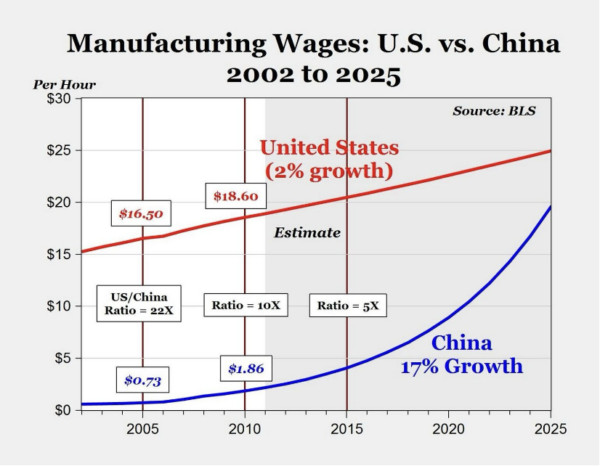
For want of doubt, the chart below tells you all you need to know. Shortly after the turn of the century, the manufacturing wage gap between the US and China was 22X and even by 2015 it was still in the 5X range. And yet, the foolish Keynesian academics in the Eccles Building saw fit to essentially contend that still more inflation was the key to prosperity, a la their 2.00% target.
Nevertheless, the great labor arbitrage is now drawing to a swift close, in large part because China has completely drained its rice paddies. That is to say, as a matter of demographics and the legacy of its one-child policy, the Red Ponzi labor force peaked in 2015 and is now shrinking and will be shrinking as far as the eye can see.
Accordingly, wage costs are rising rapidly in China because even the Red Ponzi has not found a way to repeal the laws of supply and demand. Accordingly, the wage gap has narrowed to less than 20% and will likely disappear entirely before the end of the current decade.
The Great Labor Cost Arbitrage, 2000 to 2025
The underlying truth is that the Great Labor Arbitrage was a one-time event, not a permanent condition of the global economy. There are simply no more Chinas left on planet earth or even the nearby solar system.
And that gets us exactly to the Fed's impending monetary Waterloo. It was able to print with relative impunity during the 1990 to 2020 period because the one-time export of the US industrial economy caused an utterly aberrant split screen deformation of the domestic price level.
To wit, the merchandise goods coming back into the US economy from offshore production were priced at levels far below the hideously inflated level of domestic production costs. As a result, the Personal Consumption Expenditures (PCE) deflator for durable goods (black line) actually declined by nearly 40% between 1995 and early 2020. That reflected not only the surging import share of durable goods, but the fact that on-margin imports set the price of domestically produced goods as well.
PCE Deflator: Durable Goods Versus Services, 1995 to 2020

There has never been anything like this sweeping deflation in the modern economic era. It was literally a freak of economic history, beyond any plausible avenue of continuation or replication.
By contrast, the PCE deflator for services, which are largely produced domestically and therefore within the Fed's realm of influence, rose by more than 85% during the same period.
In annualized terms, therefore, the durables index declined by 2% per annum for a full quarter-century while the services index rose by 2.5% per year. It was a pure statistical anomaly and gift of dumb luck to the Eccles Building that the resulting overall PCE deflator rose, on the math, at 1.85% per annum.
And yet, and yet. The Keynesian pointy heads at the Fed declared this spat of dumb luck to be a "lowflation" problem requiring aggressive and sustained operations of its printing presses. In effect, they were looking a gift horse in the mouth and pretending it was an ogre.
Needless to say, with Chinese wages and costs rising rapidly and the arbitrage gap nearly closed, there is not a snowball's chance in the hot place that the black line in the chart above will take another 40% dump lower. Not in a million years.
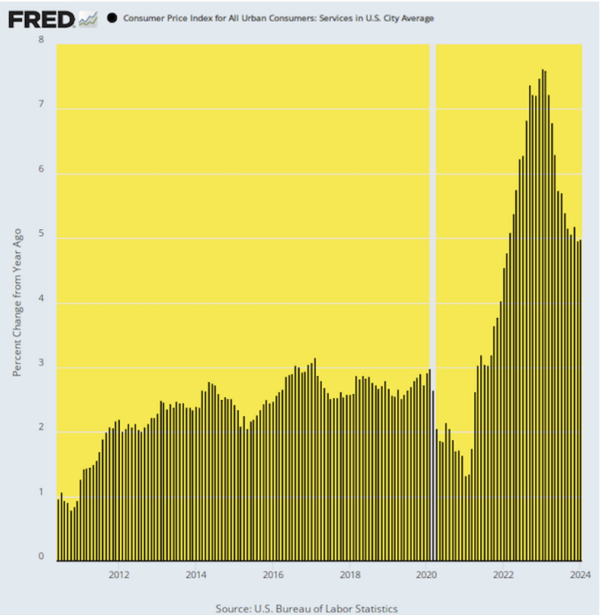
And that means, in turn, that the yawning gap in the above chart between goods deflation and services inflation will not recur. As it happens, the underlying services inflation is still in the +5% Y/Y range and will dominate the topline price level going forward far more heavily than it did during the aberrant era of 40% durables deflation.
Accordingly, the "lowflation" excuse for money printing is now deader than a doornail.
The fact is inflation isn't and won't be contained even at the Fed's specious 2.00% target. And the last two decades have proved beyond a shadow of a doubt that aggressive money printing does not spur domestic investment and productivity, and therefore overall economic growth either.
What it does do is inflate asset bubbles on Wall Street because ultra-low interest rates purportedly justify higher price-to-earnings multiples. And that's been the excuse all along for taking the Fed's balance sheet from $300 billion when Greenspan was hit with the Black Monday meltdown in October 1987 to a peak of $9 trillion a few months back.
Alas, financial asset bubbles aren't indefinitely sustainable either. They actually rang the bell on Wall Street Thursday when NVIDIA brushed up against a market cap of $2 trillion, representing 30X sales of chips that enable the likes of Google's generative AI to render portraits of black people dressed as Vikings.
Even the Tulip Bulb Mania of 1637 never went that crazy.
Y/Y Change in CPI for Services, 2011 to 2024
Reprinted with permission from David Stockman's Contra Corner.